A fantasy baseball trade analyzer evaluates player values across rotisserie, points, and dynasty formats using projected statistics, age curves, and position scarcity. By modeling multi-player package discounts and surplus value above replacement level, the calculator instantly determines trade fairness and roster category impact for both teams.
How Does the Trade Analyzer Calculate Player Value?
Evaluating player transactions in modern fantasy baseball requires balancing contemporary performance against long-term roster depreciation. Traditional fantasy trade calculators generate arbitrary valuations based on public voting or single-season past performance. Our algorithmic framework evaluates trade proposals using four discrete sabermetric pillars grounded in verified statistical models.
Core Projected Production & Statcast Valuation
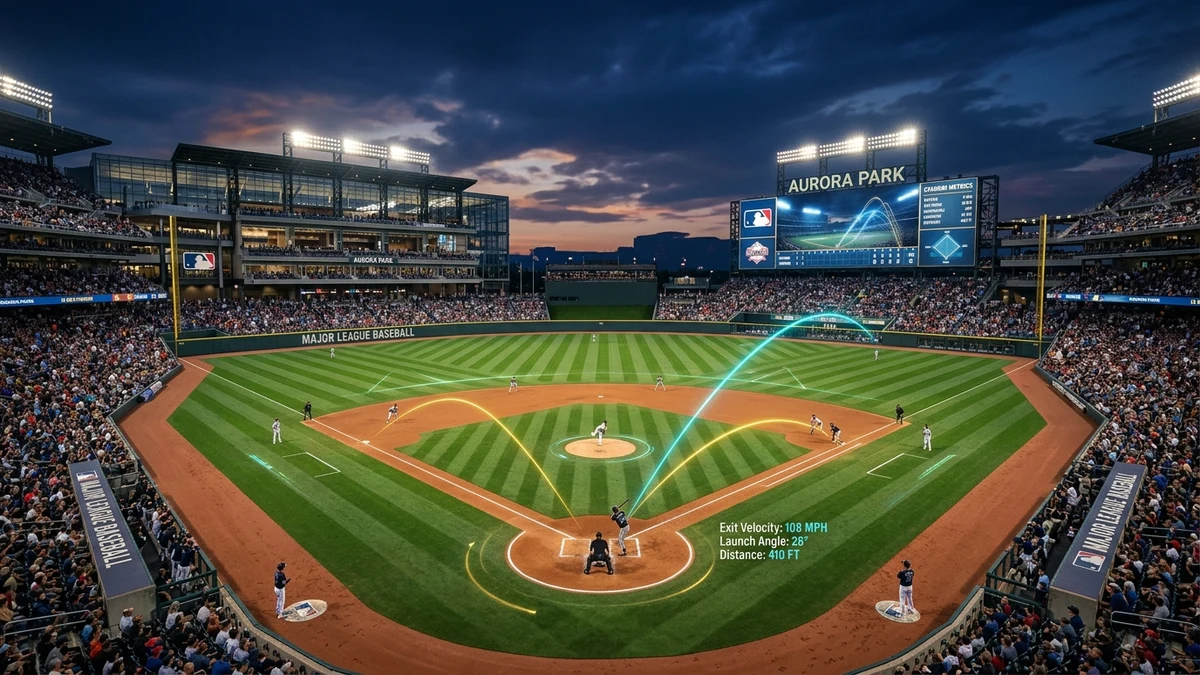
The baseline of every trade valuation begins with consensus multi-system projections weighted 50% for Year 1, 30% for Year 2, and 20% for Year 3. We refine raw projected statistics using underlying Statcast data, specifically 90th percentile exit velocity, barrel percentages on contact, and plate discipline metrics (chase rate and zone contact). A hitter maintaining a 15.2% barrel rate with a 94.1 mph average exit velocity commands higher trade equity than a hitter whose surface numbers mask declining hard-hit rates.
The Dynasty Age Curve Discount
Dynasty rosters cannot treat a 33-year-old veteran producing 5.5 WAR equivalently to a 24-year-old superstar delivering 5.5 WAR. Historical aging research shows that Major League hitters peak between ages 25 and 28, with athletic decline accelerating past age 29.5. Starting pitchers encounter sharp velocity drops and heightened injury volatility past age 28. Our system applies an empirical compound depreciation factor:
Dynasty Valuation = (Base WAR × Format Weight) × 0.88^(Age - 27.5) × Positional Scarcity This ensures that rebuilding franchises can accurately gauge when to sell aging aces before their open-market value deteriorates.
The Multi-Player Package Consolidation Tax
The most prevalent calculation failure on legacy fantasy platforms is linear package addition. In a 3-for-1 trade, adding three 10 assets together does not create a30 superstar. The team receiving three players must cut two active roster spots, sacrificing waiver wire replacement value and roster flexibility.
Our calculation engine incorporates a non-linear consolidation discount: the highest-ranked player in any package is credited at 100% value, the second asset is credited at 85%, and the third asset is credited at 70%. This arithmetic penalty accurately reflects the competitive difficulty of absorbing multiple assets onto a roster.
Scoring Format Adjustments: 5x5 Roto vs. H2H Points vs. OBP
Player trade equity shifts substantially depending on your league scoring settings. A player who ranks inside the top 15 in 5x5 Rotisserie may drop outside the top 40 in Head-to-Head Points formats:
| Player Archetype | 5x5 Rotisserie Impact | H2H Points Impact | Strategic Transaction Rule |
|---|---|---|---|
| Elite Base Stealer (50+ SB) | High Premium (+22% Value) | Moderate Discount (-14% Value) | Target speed in Roto; avoid overpaying in Points leagues. |
| High-Strikeout Slugger (35 HR, 175 K) | Neutral to Favorable | Severe Penalty (-25% Value) | Strikeouts carry minus-one point penalties in standard Points scoring. |
| High-Walk Patient Hitter (15% BB) | Moderate (Roto BA drag) | Massive Premium (+18% Value) | Walks generate points directly in H2H and boost 6x6 OBP rosters. |
| Workhorse Starting Pitcher (200 IP) | Rate-dependent (ERA/WHIP) | Elite Cornerstone (+30% Value) | Innings volume and quality starts dominate weekly point totals. |
Negotiating with draft picks? Explore 2026 FYPD Prospect Board ➔
Multi-Year ContractsFactor draft escalation into this trade with Keeper Surplus Calculator ➔
Frequently Asked Questions About Fantasy Baseball Trades
01 How are 2-for-1 trades evaluated fairly in fantasy baseball?
In competitive fantasy baseball, two $15 waiver-tier assets do not equal one $30 superstar. Our calculation engine applies a non-linear consolidation tax of 15% per additional player on the multi-asset side. This models the replacement-level production sacrificed by dropping existing roster depth to accommodate incoming players.
02 When should a rebuilding dynasty team trade away aging aces?
Starting pitchers over age 29.5 face steep performance decay curves and elevated elbow injury risk. Rebuilding managers achieve maximum roster value by trading veteran pitching assets near the mid-season trade deadline when contending rosters pay premium prospect packages to solidify playoff rotations.
03 What data feeds the player trade values?
Our valuation model combines 3-year weighted projection algorithms with Statcast underlying metrics (90th percentile exit velocity, barrel percentages, and contact rates). Each player rating reflects scoring format differences between 5x5 Rotisserie, Head-to-Head Points, and 6x6 OBP leagues.